Finding the cause of errors in heavy frameworks like Magento 2 can take time and effort. Tools like echo, var_dump, and debug_backtrace cannot cover or significantly limit developers’ needs. Xdebug for Magento 2 can successfully address this challenge for developers.
Xdebug is a powerful PHP extension designed specifically to help developers in debugging. It has a wide range of features that streamline the error-finding process and offer valuable insights. Installing this application can sometimes be tricky, so we prepared a step-by-step tutorial on configuring Xdebug for Magento 2 application via PHPStorm or VSCode.
Using Xdebug for Magento 2
Step debugging is a tool that allows you to execute code line by line while monitoring the values of variables and objects. You can also keep track of which specific function is used after a specific line of code is executed, analyze the program execution flow, and much more.
For a step debbugging in php exists an Xdebug extension. It has many features, but the most valuable are step debugging and breakpoints (you can set breakpoints to pause execution at specific points in your code). These and other features are very useful when debugging code and can cover a wide range of developer needs.
How to Configure Xdebug for Magento 2
The installation of Xdebug may differ slightly depending on the server’s operating system. In this tutorial, code examples are written for the Ubuntu operating system.
Step #1. Install Xdebug
To install Xdebug, run the following command:
sudo apt install php8.3-xdebugIf you receive the error Unable to locate package php8.3-xdebug, before installing the package you need to add a repository containing the following command:
sudo add-apt-repository ppa:ondrej/php
sudo apt update
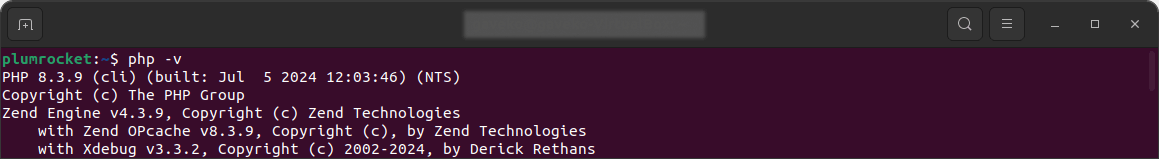
Now, after checking the PHP version, you can see that the Xdebug extension has been installed:
Step #2. Configure Xdebug
To have Magento 2 Xdebug work correctly, you need to make a number of settings, which are specified in the php.ini file. Execute the following command to find the path to the file:
php8.3 –ini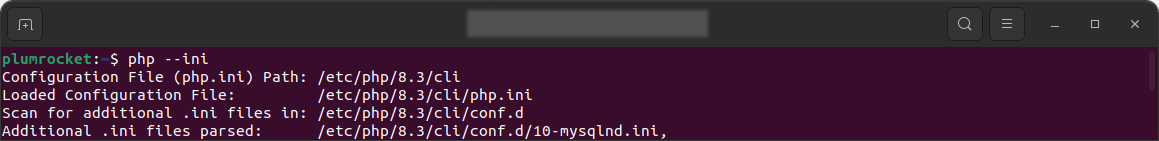
The following configurations must be added to the end of the php.ini file:
xdebug.mode=debug
xdebug.trigger_value=runcode
Step #3. Install Browser Extension to Trigger Xdebug
There are two ways of testing Magento 2 using Xdebug: via VSCode or PHPStorm. Both require the installation of a browser extension to trigger Xdebug. These extensions add cookies to HTTP requests that trigger Xdebug and initiate a debugging session.
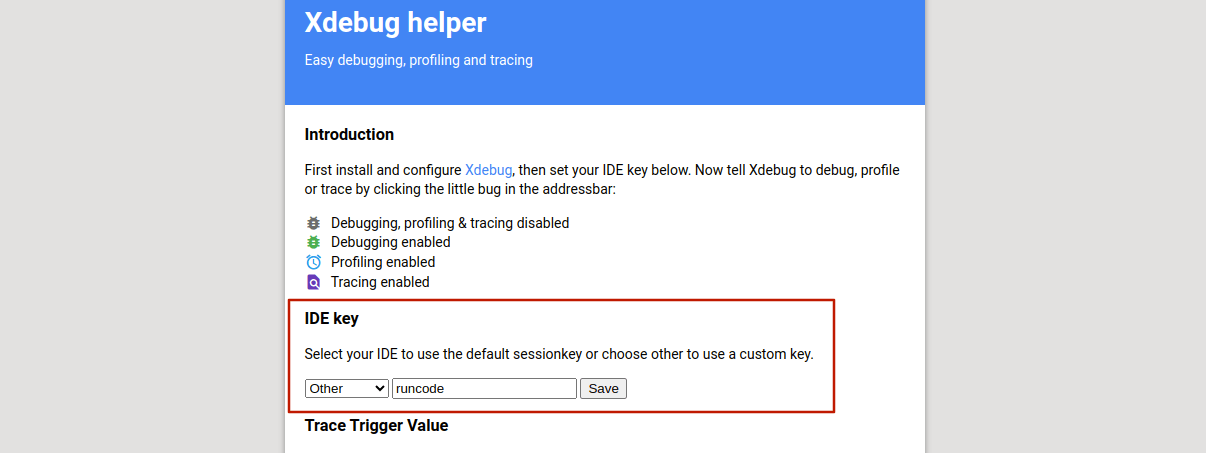
You can install these extensions, such as Xdebug helper, through the browser store.
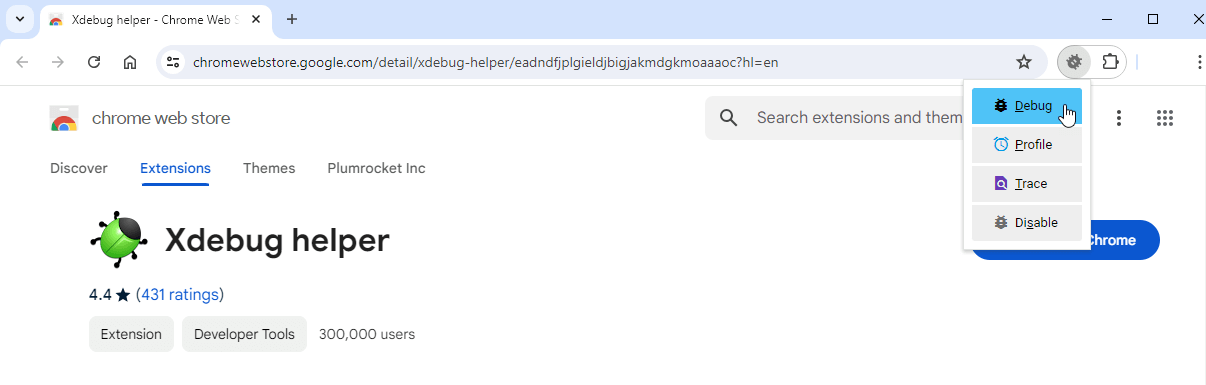
In the extension configurations, you need to specify the idekey, which will match the value xdebug.trigger_value.
Step #4. Start Magento 2 Xdebug Testing (VSCode and PhpStorm Explained)
Once you have installed and configured Xdebug and set up a browser extension to trigger it, you’re ready to begin testing Magento 2 in either VSCode or PhpStorm. Below, we offer a detailed step-by-step guide to help you through the process.
Testing Magento 2 with Xdebug in VsCode
Step-by-step guide:
- Install an extension that allows PHP code debugging. You may use PHP DEVSENSE or PHP Debug extensions.
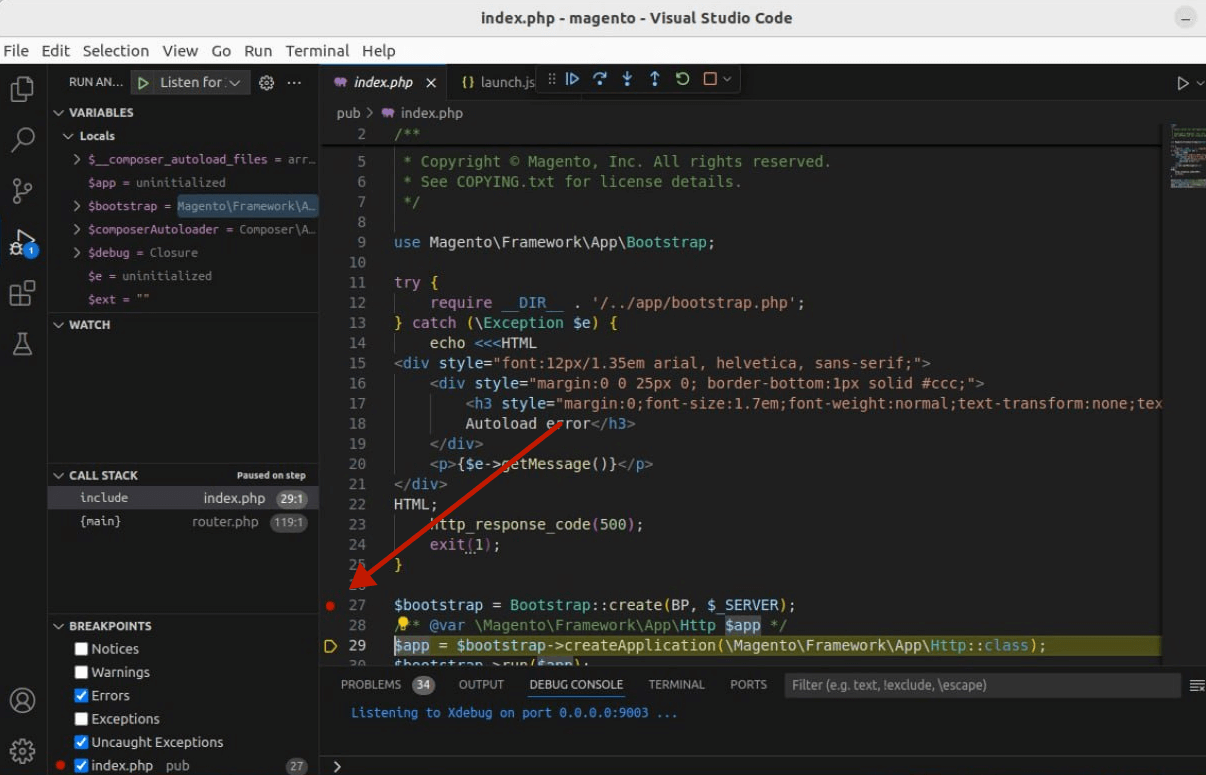
- If you test Magento 2 in a local environment, you may proceed to launch the debugging process in VSCode. Click Run > Start Debugging (or F5 shortcut) > Listen for Xdebug.
- Add a breakpoint on any line that requires debugging. Place the cursor on the left area from the code line number to trigger the red dot (circle) and click on it.
Testing Magento 2 with Xdebug in PhpStorm
Step-by-step guide:
- Click Run > Start Listening for PHP Debug Connections.
- Set the breakpoint on a line that requires debugging. To do so, navigate the cursor to the line number and click the red dot.
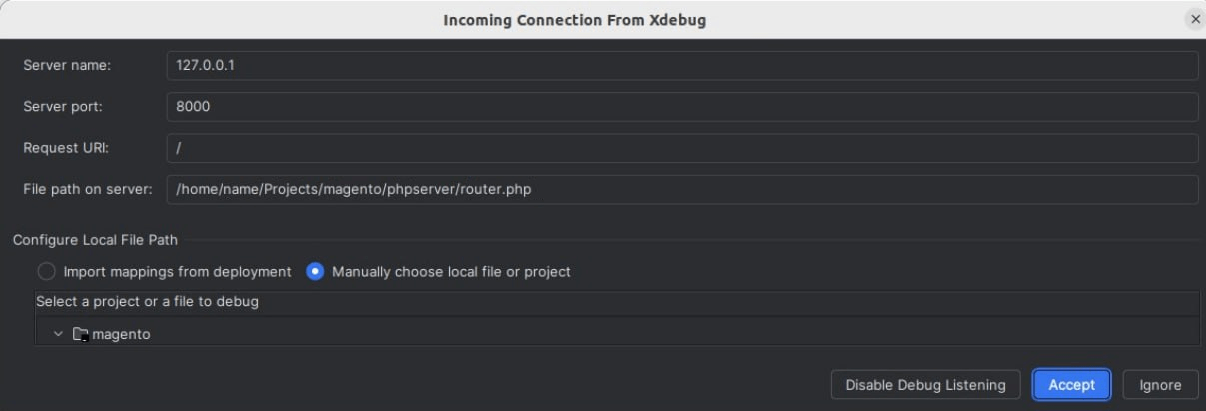
- After the first debug launch, PhpStorm will offer to automatically add the server and map the local environment and server files. If the development is carried out in a local environment, it’s enough to click Accept.
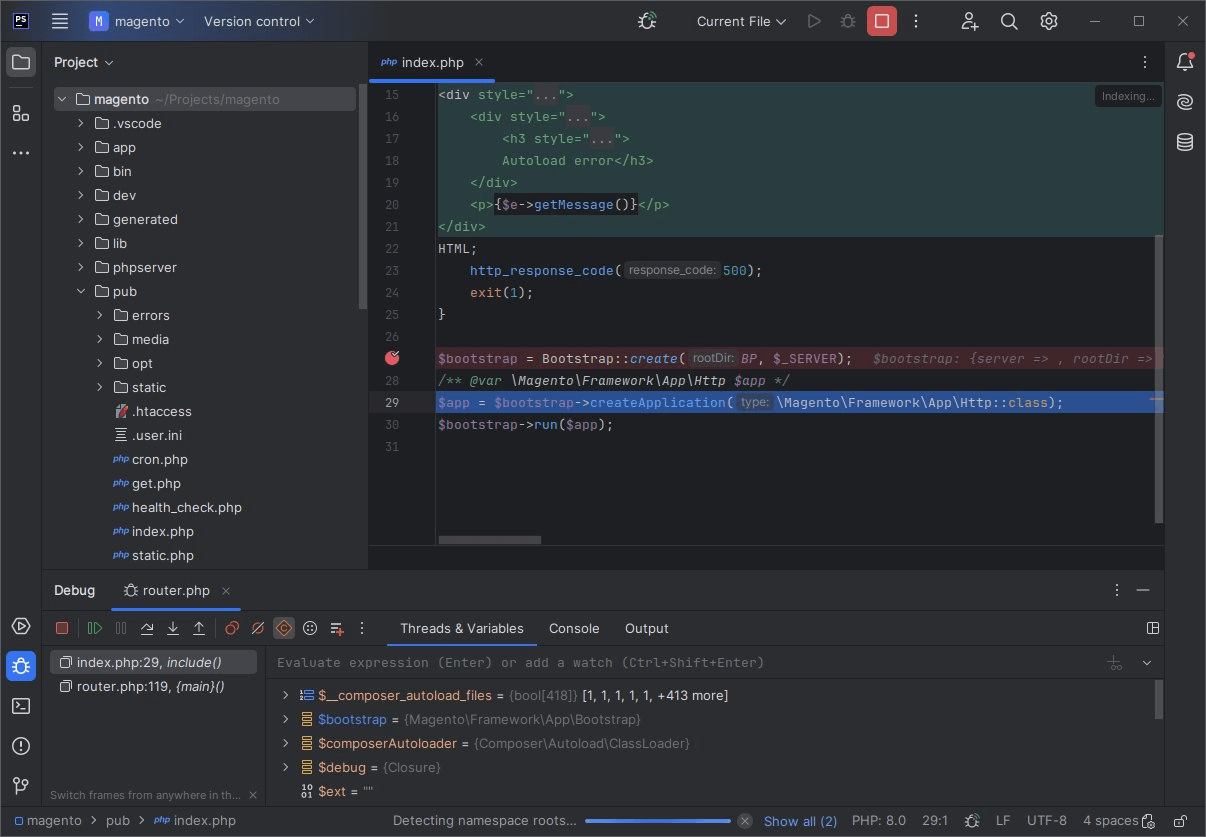
- After the connection is accepted, the debugging session will start.
We hope you found this article useful. If you have any difficulties, we are happy to help you with our Magento development services. Please comment and share. Thanks for reading!